4 Epidemiology Methods
4.1 Dataset exploration
We will use the data from NHANES for demonstration, specifically demographic data. The first step, is to pull data from CDC website using nhanesA package. I will save the data into demo
It is possible to explore the data pulled. There are various ways such as exploring dimensions. This will show you how many rows do you have in your dataset, and number columns. Specifically, for “demo”, we have 9,965 rows and 144 columns.
## [1] 9965 144It is also possible, to look at structure of the dataset, even far, looking the structure of each variable. Here, I mean the type of variable; numerical, factor, integer,…. This way will also show you how if some missing values are present. To look at entire structure, the analysst can use str(demo), however, because here we have 144 columns, we will present only 10 variables.
## 'data.frame': 9965 obs. of 10 variables:
## $ SEQN : num 1 2 3 4 5 6 7 8 9 10 ...
## $ SDDSRVYR: Factor w/ 1 level "NHANES 1999-2000 Public Release": 1 1 1 1 1 1 1 1 1 1 ...
## $ RIDSTATR: Factor w/ 2 levels "Interviewed Only",..: 2 2 2 2 2 2 2 2 2 2 ...
## $ RIDEXMON: Factor w/ 2 levels "November 1 through April 30",..: 2 2 1 2 2 2 2 1 2 2 ...
## $ RIAGENDR: Factor w/ 2 levels "Male","Female": 2 1 2 1 1 2 2 1 2 1 ...
## $ RIDAGEYR: num 2 77 10 1 49 19 59 13 11 43 ...
## $ RIDAGEMN: num 29 926 125 22 597 230 712 159 133 518 ...
## $ RIDAGEEX: num 31 926 126 23 597 230 712 160 133 518 ...
## $ RIDRETH1: Factor w/ 5 levels "Mexican American",..: 4 3 3 4 3 5 4 3 4 4 ...
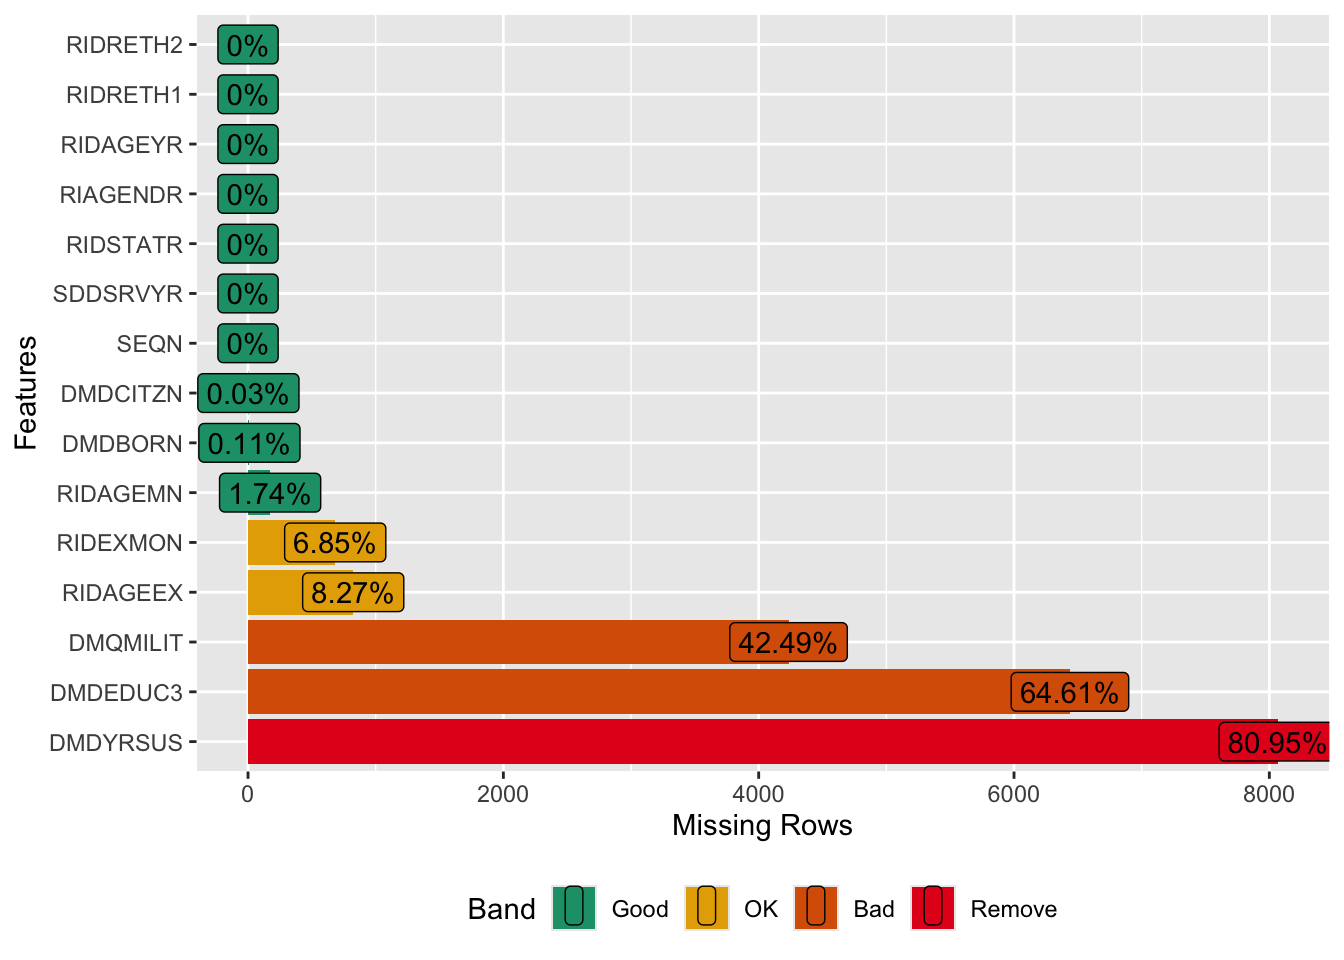
## $ RIDRETH2: Factor w/ 5 levels "Non-Hispanic White",..: 2 1 1 2 1 4 2 1 2 2 ...You can also exploring percentage of missing values for each variable. To visualize this you must use “plot_missing”. To perform this, you need library(DataExplorer). For all variables, this operation can be done plot_missing (demo). However, for simplicity, we will present only 15 variables.